You can find information about soapmaking in the oddest places and by the strangest methods. Recently, I found out about the numbers of soapmakers around the turn of the (last) century while celebrating my birthday!
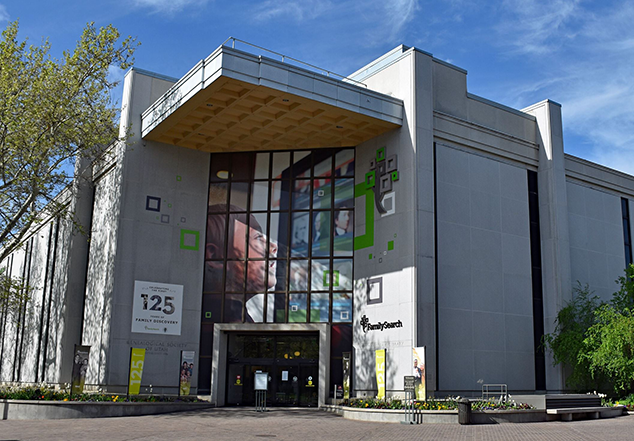
Birthdays in our family are a day when you can do (or not do) whatever you want. In the past I’ve used my special day to sleep in, have a movie marathon, take a scrapbooking class, and go on a girl’s day out. This year I scheduled a trip to Salt Lake City to see a customer, so I could take my birthday in the Family History Center researching my family tree.
I wish I could say that I discovered amazing facts and documented a long lineage I hadn’t had before, but that wasn’t the case this time. I didn’t expect it to be; I was seeking out an elusive great-great-grandfather that I hadn’t been able to find previously.
I did, however, stumble upon a census record that listed “soapmaker” as the occupation. It wasn’t my ancestor (wouldn’t that have been cool!) but it did lead me on another quest. I started researching the data available in census records for soapmakers.
From 1870 to 1900, soapmaking was listed and tablulated as a unique occupation.
- In 1870, there were 1900 men and 42 women listed as soapmakers. Women made up 2.2% of the whole.
- In 1880, there were 2718 men and 205 women listed as soapmakers; women were 7.5%.
- In 1890, there were 3052 male and 299 female soapmakers; women were 13.1%.
- In 1900, there were 3291 male and 731 female soapmakers; women were 22.2%.
Starting in 1910, soapmaking was classed as a subset of “chemical manufacturers” and all that was recorded was the number of people working as “laborers” in a soap manufacturing facility.
Interestingly enough, if you extrapolate the increase in women soapmakers up to 2000, it comes out to be pretty close to the percentage of women vs. men we’ve seen in the Handcrafted Soapmakers Guild!


Leave a Reply